Friday 21 February 2014

Dingle Bay 2013

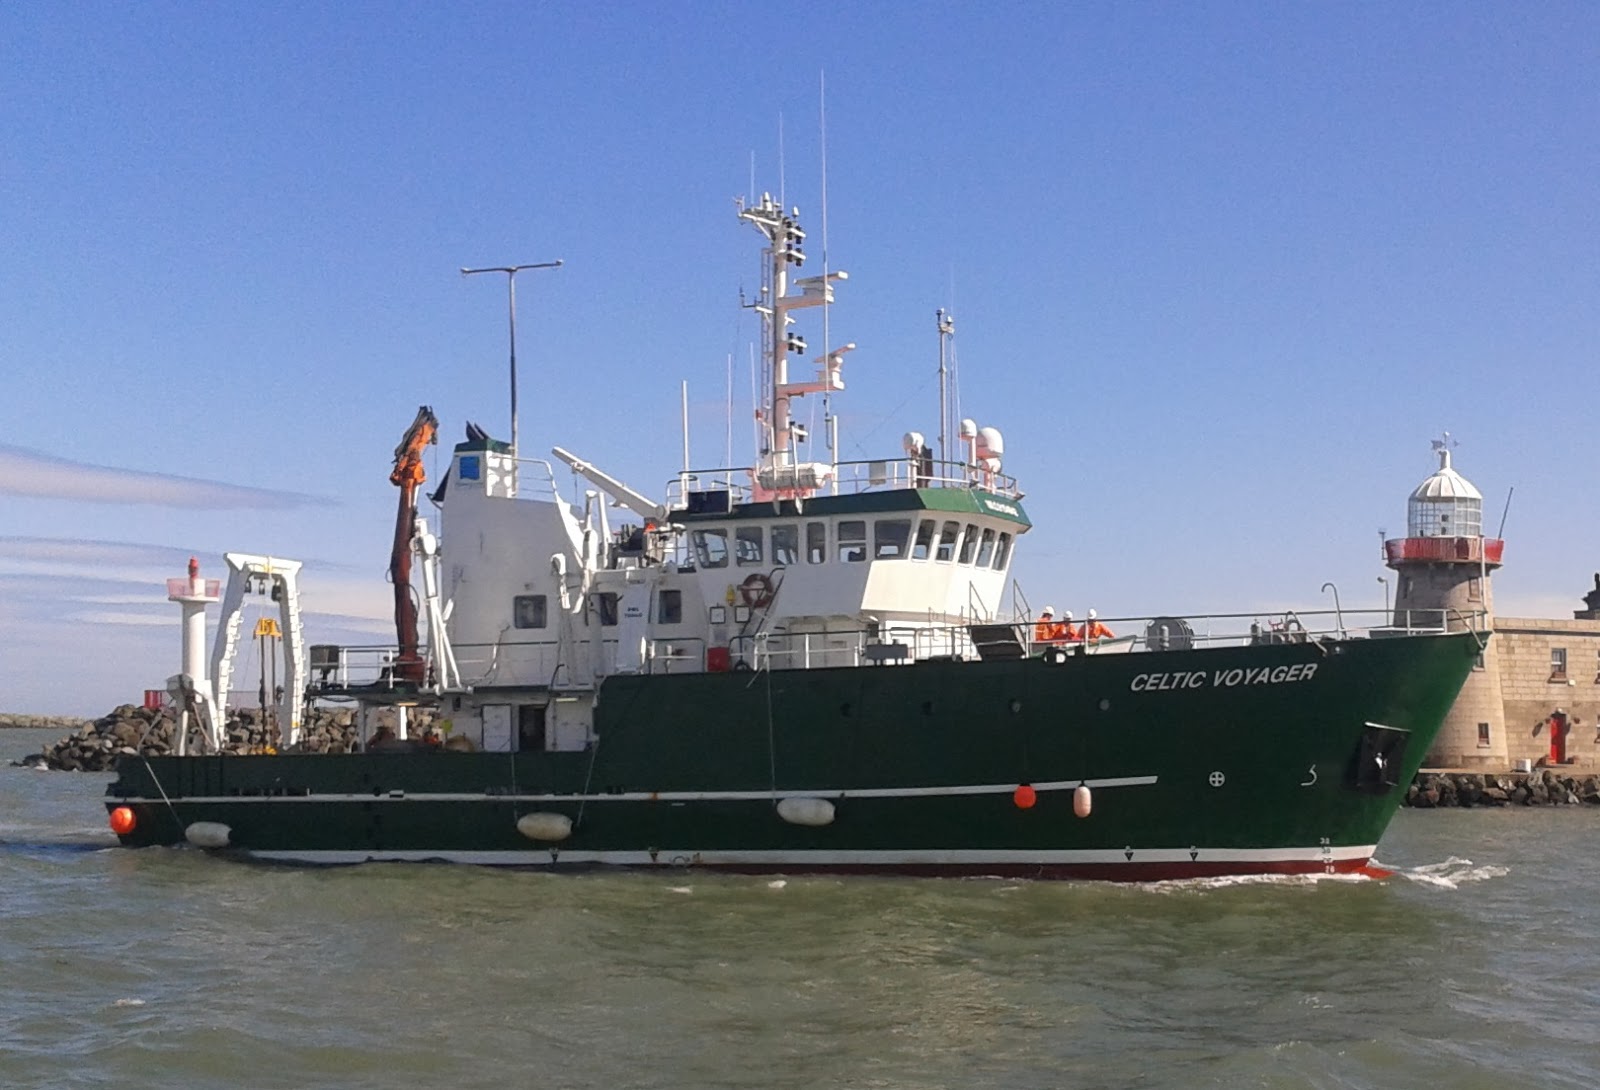
From 18th June to 21st July 2013, INFOMAR vessels operated by the Geological Survey of Ireland (GSI) carried out survey operations in Dingle Bay. This seabed mapping extended multi-beam coverage that had previously been acquired by the Marine Institute (MI) in 2009. During that survey leg, the MI research vessel Celtic Voyager mapped the bulk of the deeper waters of the bay.

The GSI vessels R.V. Keary, M.V. Cosantóir Bradán and R.V. Geo finalised the seabed map by focusing their efforts on the shallower waters along the coast, along with surveying areas of seabed around the islands of Great Blasket, Inishnabro, Inishvickillane, Tearaght and Inishtooskert. The figure below shows the extent of each vessel's survey leg, including the 2009 leg operated by the R.V. Celtic Voyager.

Click on the image to see a larger view. The legend displays colours for the following survey legs: KRY13_04 (R.V. Keary), CB13_03 (Cosantóir Bradán), GEO13_03 (R.V. Geo), CV09_02 (R.V. Celtic Voyager).

Dingle Bay Survey Legs


The M.V. Cosantóir Bradán and the R.V. Geo began surveying in late June, with the R.V. Keary joining the operation in early July. The Cosantóir initially focused her efforts on mapping the waters off the coast of Inch and Rossbeigh beaches in the inner bay, while the Geo mapped the shallow waters of Ventry and Dingle harbours and a narrow strip running along the northern coastline of the bay. Once her operations in the inner bay were complete, the Cosantóir mapped a large area of seabed around the Great Blasket and Inishtooskert islands, along with an area to the north of Valentia Island. Once the Keary was on site, she carried out survey operations off the coast of Coumenole Beach and an area of seabed around the islands of Inishnabro and Inishvickillane. Both vessels mapped either side of Tearaght Island. The R.V. Geo also carried out mapping north of Valentia island.

For further information on the survey vessels operated by the GSI and the MI, see http://www.infomar.ie/surveying/Vessels.php. Below are images of the three GSI vessels that took part in this survey:

R.V. Keary

M.V. Cosantóir Bradán

R.V. Geo

Below is a series of images detailing the bathymetric data (water depths) acquired during the 2013 Dingle Bay Survey. Note that this data is still in the process of being finalised and checked for errors and therefore contains some inaccurate depth information. The units of the colour scales are "metres below LAT" (Lowest Astronomical Tide) and are included to give an approximate impression of water depth.

Several areas mapped were found not to agree with existing nautical charts - notifications of these hazards were sent to the United Kingdom Hydrographic Office for the purposes of chart corrections.


Overally Bathymetry for 2013 Survey


Note the survey lines crossing the middle of the bay - these were mapped while the vessels were in transit to and from their survey areas around the edges of the bay. This data can be compared with Celtic Voyager data in the same areas for the purposes of quality control.

Dingle Harbour


Ventry Harbour

Shallow bank off the coast of Inch (note: this image uses a different colour scale range from the other images)


Inishtooskert and Great Blasket Islands


Inishnabro and InishVickillane


Craggy coastline of Inishnabro island

 Jagged rock in Ventry harbour


R.V. Geo surveying near the cliffs of the Iveragh Peninsula


Tuesday 11 February 2014

INIS-Hydro Completion

Between May and June 2013, INFOMAR survey vessels carried out seabed mapping operations in Dundalk Bay, finalising their contribution to the INIS-Hydro Project.

This was the completion of mapping that began in 2011 - see the following blogs for details: http://infomarupdates.blogspot.ie/2011/11/inishydro-project.html and http://infomarupdates.blogspot.ie/2012/06/inishydro-2012-progress.html

INIS-Hydro was a 3 year INTERREG IVA Programme with the Maritime and Coastguard Agency (MCA) in the UK as lead partners. The project brought together 7 partners to conduct hydrographic surveys in Ireland, Northern Ireland and Scotland. The partners are the MCA, Geological Survey of Ireland (GSI), Marine Institute (MI), the Agri-Food and Biosciences Institute (AFBI), the Scotish Association of Marine Science (SAMS), the Northern Lighthouse Board (NLB) and the United Kingdom Hydrographic Office (UKHO).

The surveys were undertaken in Dundalk Bay, Carlingford Lough, Dundrum Bay, the Firth of Lorn and South West of Islay by several different vessels drawing on expertise from the various partners. The bathymetric data delivered 3D baseline maps using multibeam echosounder technology which will be freely distributed. The project aims to harmonise hydrographic survey specifications and synchronisation for future surveys.

Dundalk Bay was surveyed by the Marine Institute (MI) and the Geological Survey of Ireland (GSI), who took responsibility for blocks 1 and 2, respectively, as shown in the image below:


Block 1 was surveyed by the R.V. Celtic Voyager, while the GSI vessels R.V. Keary, R.V. Geo and M.V. Cosantóir Bradán surveyed the shallower waters of Block 2 (though elements of block 1 were also surveyed by the M.V. Cosantóir Bradán).

R.V. Celtic Voyager

R.V. Keary


R.V. Geo


M.V. Cosantóir Bradán

Overall, seven seperate survey legs were required to complete the mapping of this large area. The following image shows the extent of each of these survey legs. Each leg is coded according to the vessel that undertook it (Celtic Voyager = CV, Keary = KRY, Geo = GEO and Cosantóir Bradán = CB), followed by the year and that vessel's particular leg number of that year (e.g. KRY11_06 is the Keary's sixth survey leg of 2011 - the previous 5 survey legs would have taken place in other locations around the Irish coast).


The following image shows the bathymetric data (water depths) acquired over all seven legs:


The mapping of Dundalk Bay was a challenging endeavour. Exposed to many wind directions, the vessels engaged in shallow water mapping were often hampered by the weather. Easterly winds were particularly disruptive to survey operations, as the quality of acquired data diminishes rapidly with increasing wind (and therefore, choppier seas). In addition to this, the shallow nature of the inner bay extended the duration of the overall project. The reason for this is that the width of the track mapped by each pass of a survey vessel actually narrows as the water depth decreases, increasing the time it takes to map a given area as the vessel moves into shallower waters.The R.V. Geo in particular had to contend with this law of diminishing returns.

Three interesting shipwrecks were imaged as part of the mapping process. They are visible in the following images:

Sunken meteorological station - 3D view

 The Topaz - 3D view (wreck information sheet at http://www.infomar.ie/data/Shipwrecks/Box45/pdfs/SSTopaz_Final.pdf)

The Crusader

Along with the shipwrecks, a host of other interesting seabed features were mapped, including this large channel feature in the centre of the bay:


A backscatter image was also produced during processing of the bathymetric data. This image is a measure of the strength of the reflection of the vessels' sonar pulses off the seafloor - thus giving an impression of relative hardness of different seabed types. In the backscatter image below, darker patches are indicative of harder seabed types:


In addition to the seabed mapping operations, the R.V. Keary and the R.V. Celtic Voyager also carried out seabed sampling. This process involves lowering a device to the seafloor, called a grab sampler, which on impact closes a pair of jaws and retrieves a sample of whatever sediment type is there. See the following video clip for a demonstration of this: http://www.youtube.com/watch?v=B06Fw0MEfd0. The following map shows the locations at which seabed sampling was carried out:


The following images show examples of sediment types retrieved from the seabed (sand and gravel, respectively):